Trend
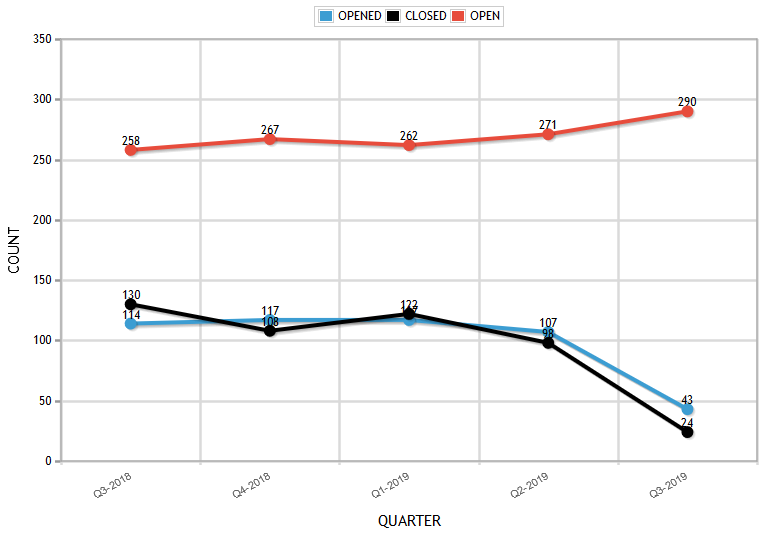
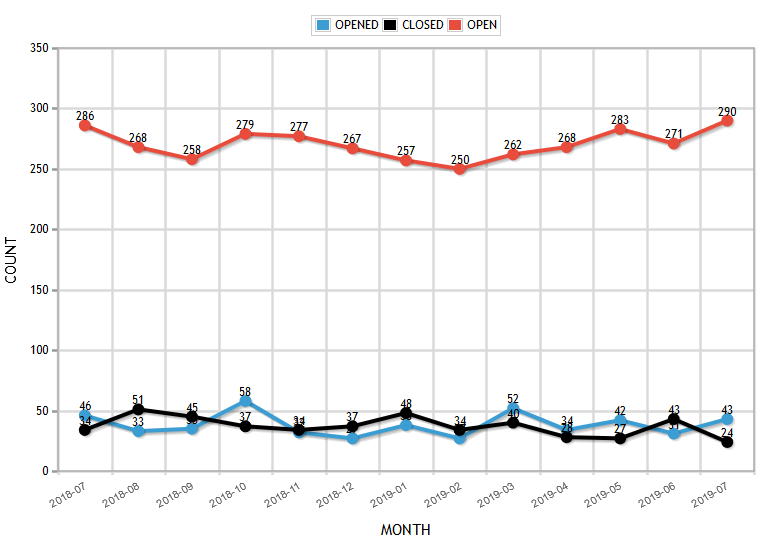
The Trend report shows how many Q-cases were opened in one month, how many Q-cases were closed in the month, and how many are still open in the system.

To keep the data within the report manageable and to assure a fast loading time only the data from the last 12 month will be shown. By clicking on the -icons the analysis timeframe can be changed to and period in time.

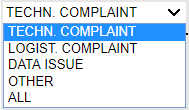
It is possible to further analyze data by different classifications. By default it is set to “TECHNICAL COMPLAINTS”. The filter can be changed at any time, by using the drop down on the left side of the screen.

In order to get a quick overview, the graphics are displayed in quarters by default. At any time, however, you can also switch to a monthly reporting scheme.

