Top Ten
The TOP TEN analysis contains three individual reports:
- by material numbers,
- by suppliers and
- by root causes
The each report can be selected by clicking on the respective button.
To keep the data within the report manageable and to assure a fast loading time only the data from the last 12 month will be shown. By clicking on the -icons the analysis timeframe can be changed to and period in time.

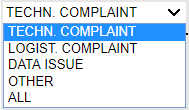
It is possible to further analyze data by different classifications. By default it is set to “TECHNICAL COMPLAINTS”. The filter can be changed at any time, by using the drop down on the left side of the screen.
Material number
The material number report analyzes the frequency of the material numbers assigned to a Q-case.
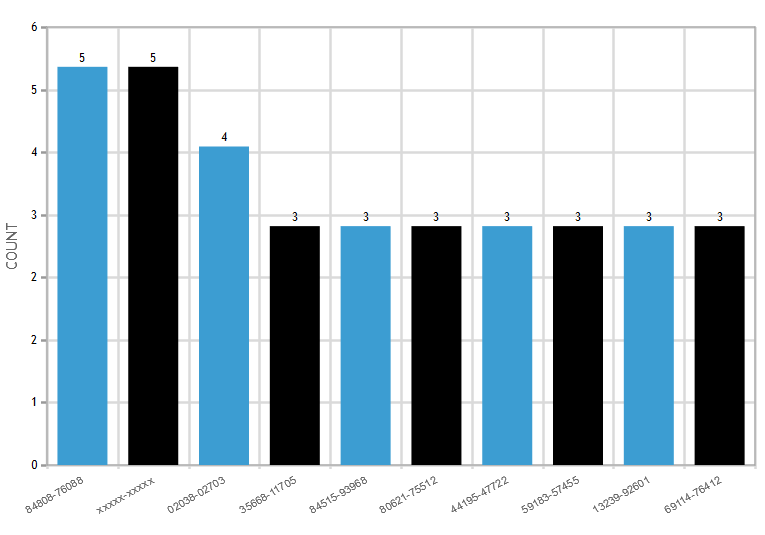
The evaluation does not take into account whether the material was the cause of the error, only the frequency of the number is counted.
The material number “xxxxx-xxxxx” can be excluded from the report, as these are Q-cases without a related material.

Supplier
The report generates a Top Ten chart based upon Q-cases and the suppliers associated.
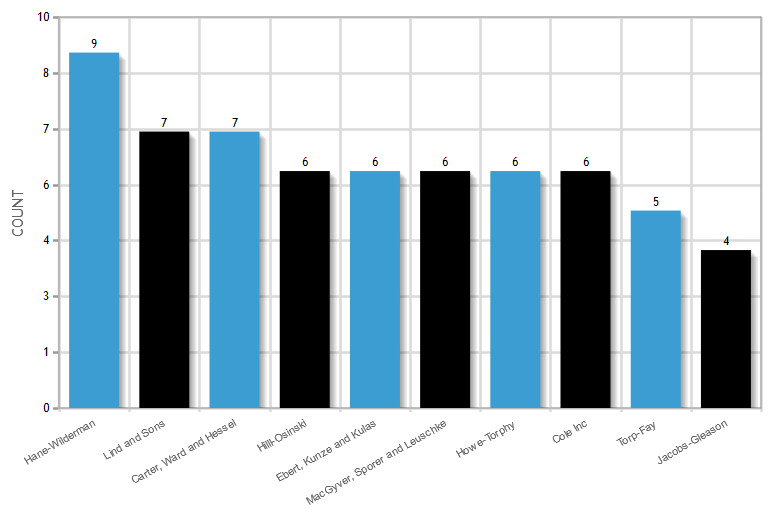
The report does not take into account whether the supplier was the cause of the error, only the frequency of the supplier is counted.
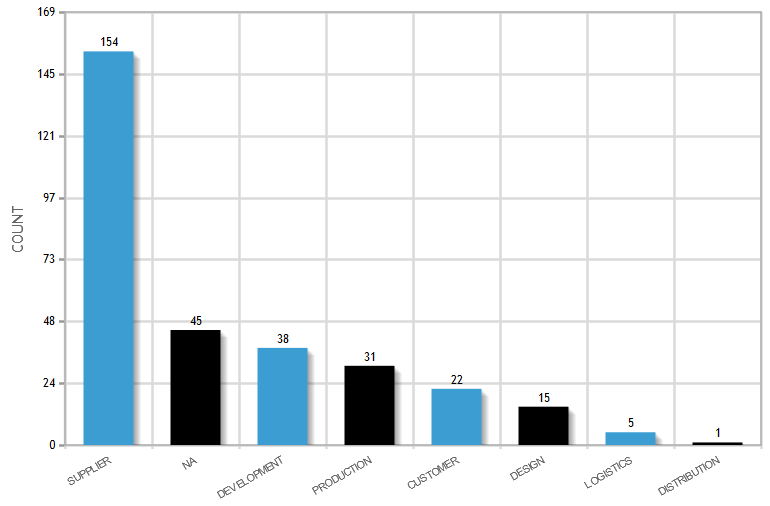
Root Cause
The report for the root cause of the error analyzes the frequency of the error cause, which is assigned to a Q case.
