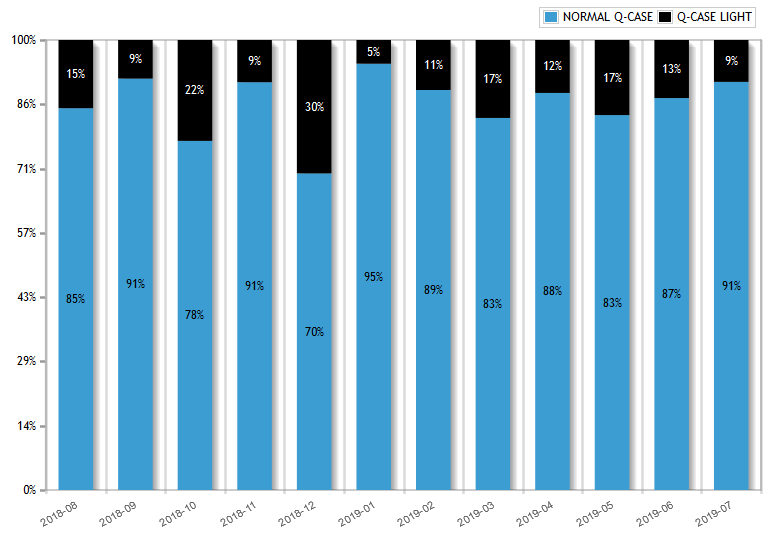
Normal / Light
This analysis shows the relationship between normal Qcases and Qcase Lights per month (if Q-Fall light is allowed in the configuration).

To keep the data within the report manageable and to assure a fast loading time only the data from the last 12 month will be shown. By clicking on the -icons the analysis timeframe can be changed to and period in time.

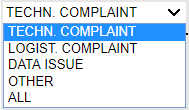
It is possible to further analyze data by different classifications. By default it is set to “TECHNICAL COMPLAINTS”. The filter can be changed at any time, by using the drop down on the left side of the screen.
