Immediately closure
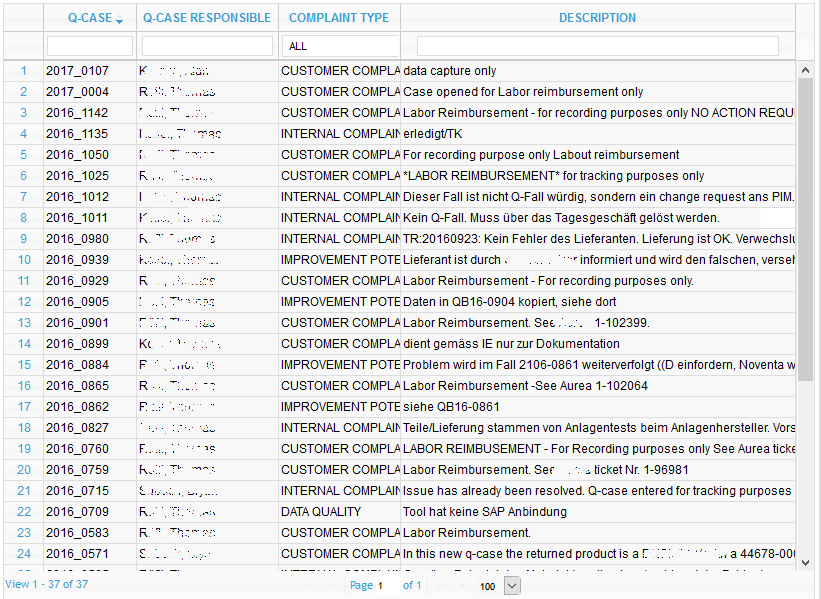
It can be interesting to see how many Q-cases are closed immediately by whom for what reason. For this reason, the report shows a table with all immediately closed Q-cases, including the name of the person who closed the case as well as the explanation for the closing.

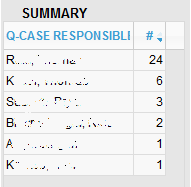
In the left part of the evaluation, there is also a statistic, which shows how often individuals have immediately closed a Q-case.

Since it is in the task area of an administrator and also quality professionals is to close Q cases immediately, these names are accumulated in the statistics. To clean the statistics around these names, they are not displayed. But you can include administrators and quality professionals in the evaluation, by clicking on the button SHOW ADMINS

To keep the data within the report manageable and to assure a fast loading time only the data from the last 12 month will be shown. By clicking on the -icons the analysis timeframe can be changed to and period in time.

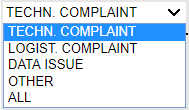
It is possible to further analyze data by different classifications. By default it is set to “TECHNICAL COMPLAINTS”. The filter can be changed at any time, by using the drop down on the left side of the screen.

Furthermore, the evaluation can be exported to Excel or displayed as a graphic. These two functions, display exactly the contents of the table, i.e. When you filter the table, only the filtered results are displayed.

