General
The General report contains four evaluations:
- The current status of Q-cases,
- An overview of open Qcases(internal / external),
- An analysis of the error causes,
- The ratio of Q-cases to Q-case Lights
On the left panel you can select between these reports.
To keep the data within the report manageable and to assure a fast loading time only the data from the last 12 month will be shown. By clicking on the -icons the analysis timeframe can be changed to and period in time.

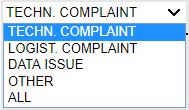
It is possible to further analyze data by different classifications. By default it is set to “TECHNICAL COMPLAINTS”. The filter can be changed at any time, by using the drop down on the left side of the screen.
Status
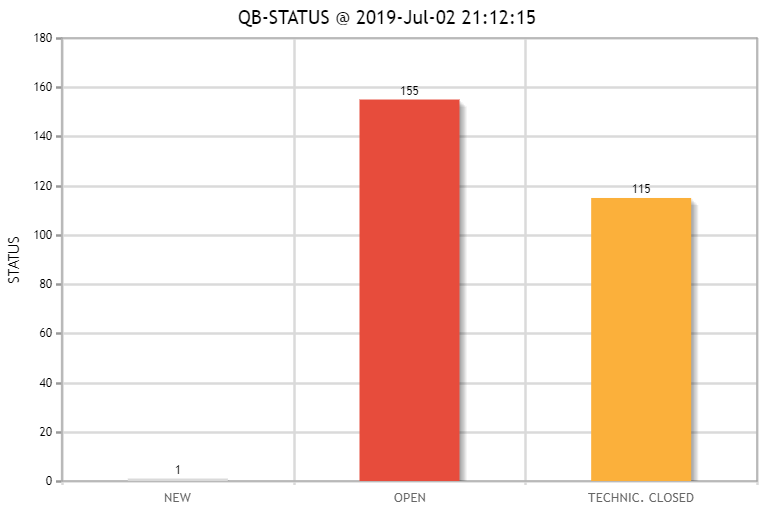
The data in the analysis is current from the time the analysis was run.
Opened
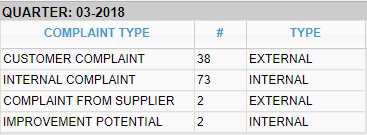
The “Opened” evaluation shows the source of the Qcase request (for example, externally from customers).
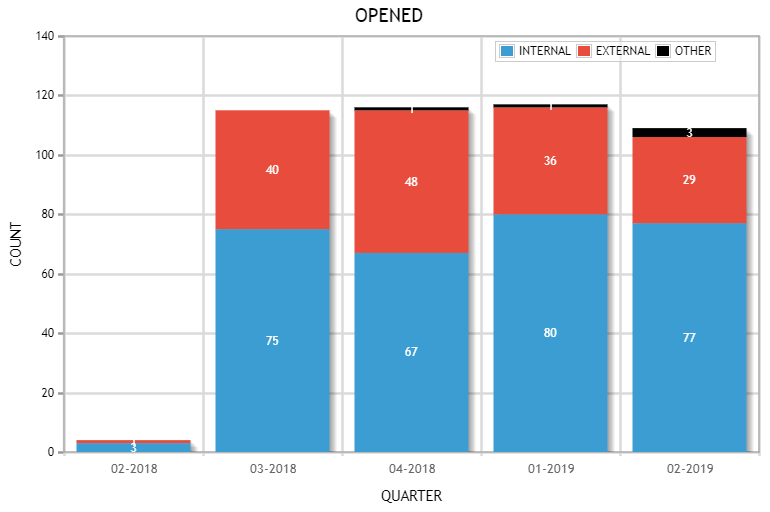
Further analysis can be done by clicking on a single quarter of the report. This will open a pop-up window. This will cause data for the quarter to be displayed in a tabular view.
Root Cause owner
This report shows a breakdown of root cause owner fault codes.

The quarter in the evaluation refers to the creation date. However, since the error originator is only entered when a Q-case is closed, this graphic can change over time.
Q-case Light
The evaluation Qcase Light shows the distribution of normal Q-cases in relation to Q-cases Light and Top Q-cases.
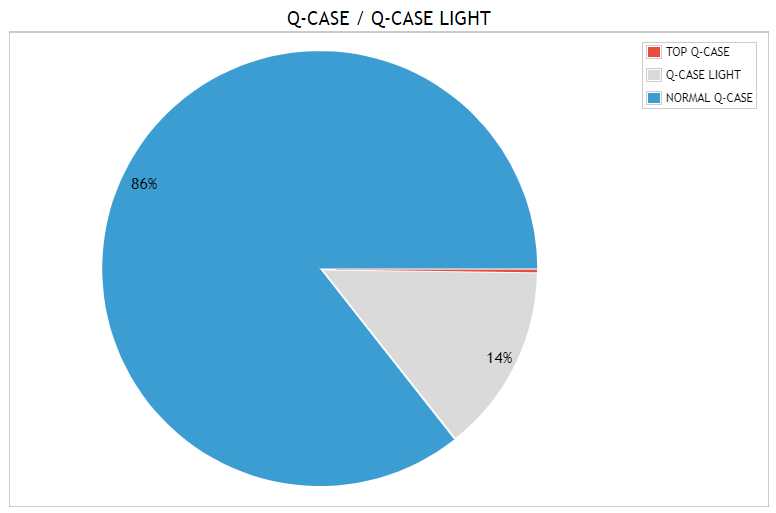
Clicking on the chart with your mouse will cause the percentage to change to the actualy quantity, clicking again will change it back.
This graphic is only available when “Q-case light” is activated in the system configuration.