Free query
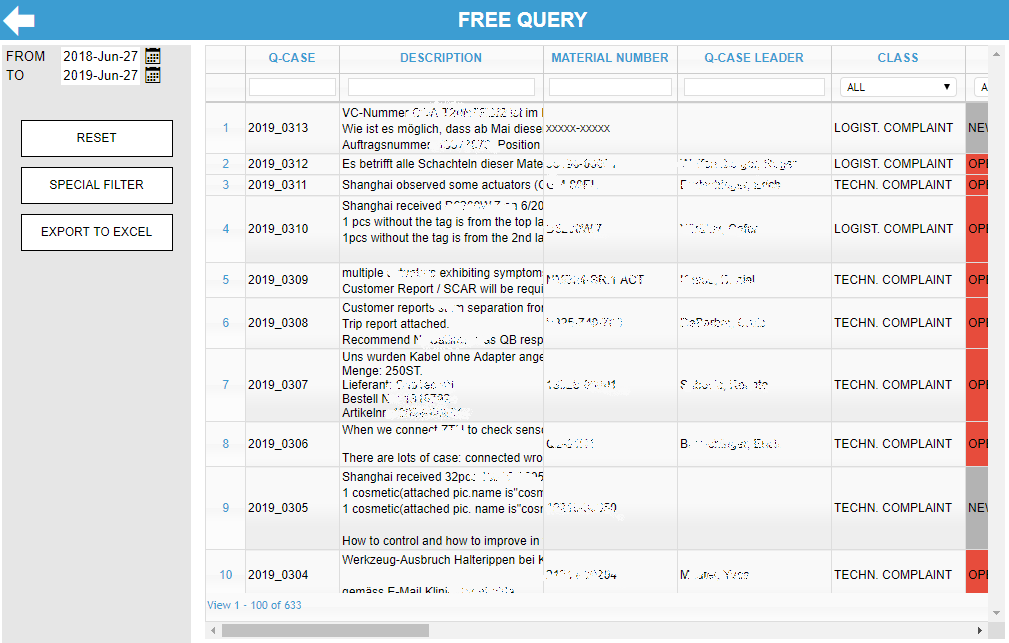
The “FREE QUERY” represents the most important data of a Q-Case in one table.

In each column of the table a text can be entered into the fields below the column headers to do a quick search on the table.
Searches can be entered in more than one column, they will be OR-ed
To keep the data within the report manageable and to assure a fast loading time only the data from the last 12 month will be shown. By clicking on the -icons the analysis timeframe can be changed to and period in time.

The table itself is very large, which means that you have to scroll with the scroll bar to the right to see all the data. If someone is interested only in certain columns, you can either move the columns you are interested in to the visible range or hide other columns. To do so a right-click on any column header will open a pop-up window in which the order of the columns can be changed and also columns can be hidden.

When exporting to Excel, the view is exported as it was previously selected; i.e. only the displayed columns are exported in the specified order.
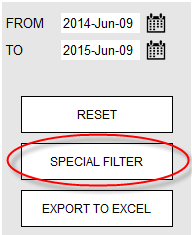
For any additional required filtering you can use “SPECIAL FILTER”.

By clicking on the “SPECIAL FILTER” button a new window for selecting the filter settings will open. In this window, you can adjust all existing columns with additional search criteria.

By clicking on the “plus” icon, you can add new columns to filter, so it is possible to select multiple columns.

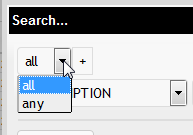
The special filter uses by default an “AND” linking of all filters. If you want to create an “OR” linking you have to select “all” instead of “any”.
As for all tables: right-clicking on a specific Q-case will open a new window with the detailed data of the case.
The form remembers the filter settings until the browser is closed. The filter settings can therefore be “reset” by clicking “RESET” button