Cycle times2
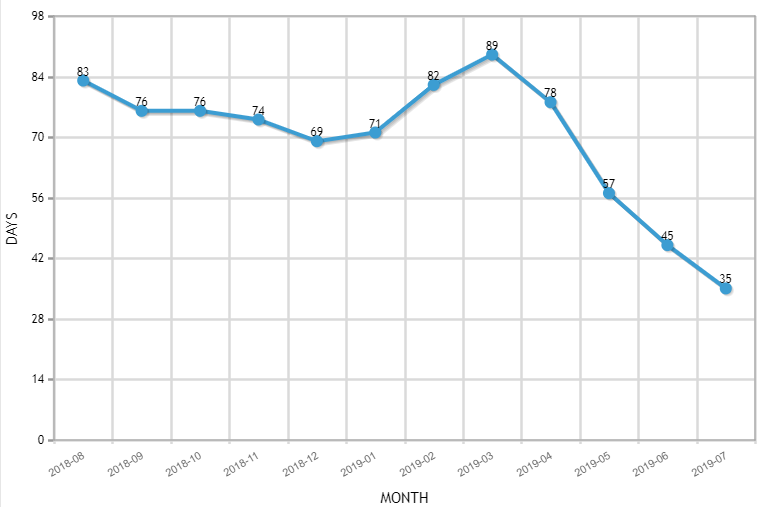
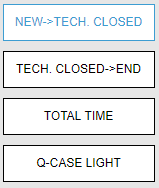
The difference between this report Cycle Times 2 and the Cycle Times report is this report calculates the median time of Q-cases steps. In this report you can select between the various milestones to have calculated. Beginning with the new state to technically closed, from technically closed to completed, from new to completed and for Q Cases light from new to completed.

Using the icons on the left side of the screen, you can choose which of the times you would like to see, by clicking on the appropriate selection.

To keep the data within the report manageable and to assure a fast loading time only the data from the last 12 month will be shown. By clicking on the -icons the analysis timeframe can be changed to and period in time.

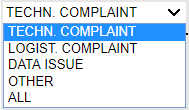
It is possible to further analyze data by different classifications. By default it is set to “TECHNICAL COMPLAINTS”. The filter can be changed at any time, by using the drop down on the left side of the screen.

Since sufficient data points have to be available for the statistical calculation, this evaluation can be used to specify the point in time at which the analysis is to be viewed (selection offset in months from the current date) as well as the period over which the data is to be averaged (mean value 3 states that the month and the previous two months are used for the respective calculation).

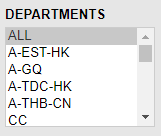
It is also possible to restrict Q-cases to departments, i.e. When a department is selected (on the left side of the screen), only the Q-cases including the selected department evaluated are evaluated.

Using the Ctrl-key you can select more than one department at a time.