Cycle times
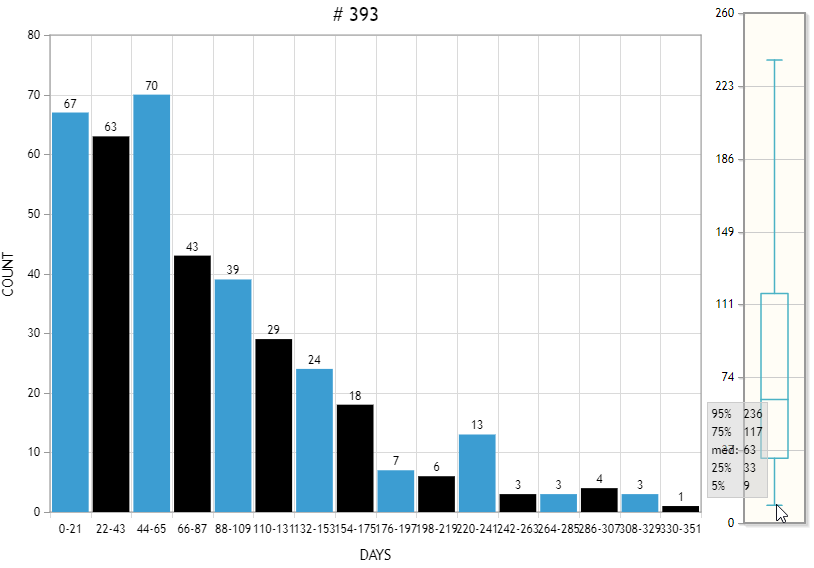
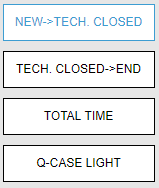
The Cycle Times report displays a histogram of the time it took for a Q-case to move from new to technically closed, from technically closed to completed, from new to completed, and for the Q-case light to move from new to completed.

On the left side of the screen, you can make a selection for whichever cycle time you would like.

To keep the data within the report manageable and to assure a fast loading time only the data from the last 12 month will be shown. By clicking on the -icons the analysis timeframe can be changed to and period in time.

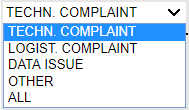
It is possible to further analyze data by different classifications. By default it is set to “TECHNICAL COMPLAINTS”. The filter can be changed at any time, by using the drop down on the left side of the screen.

The diagram consists of two parts:
- the histrogram shows the processing times
- the box whisker plot represents the 25% and 75% percentile, the dash in the box the median. The bars above or below the box are the 5% and 95% percentiles
The values of the individual percentiles are displayed by moving the mouse over the 5% (bottom dash) percentile.