8D Analysis
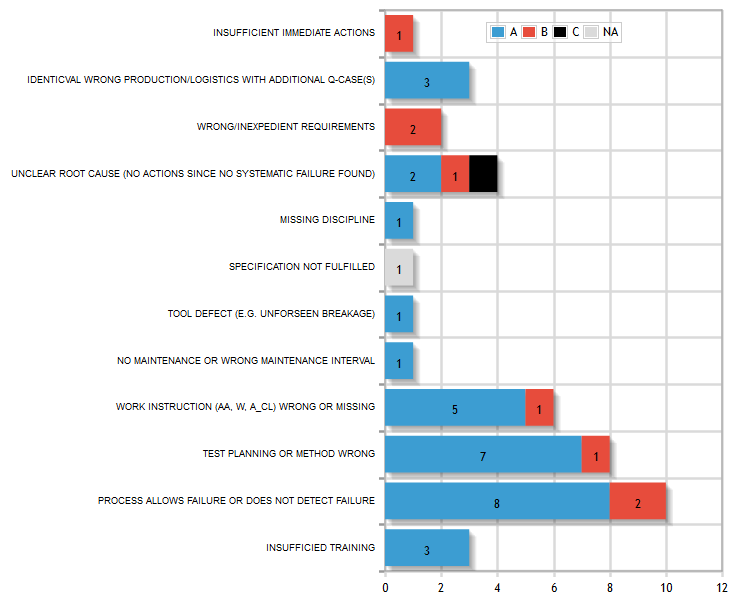
The 8D Analysis shows an overview of the causes of a Q-case split according to the supplier classification (A, B or C ). This graph shows the most frequent failure causes.

To keep the data within the report manageable and to assure a fast loading time only the data from the last 12 month will be shown. By clicking on the -icons the analysis timeframe can be changed to and period in time.

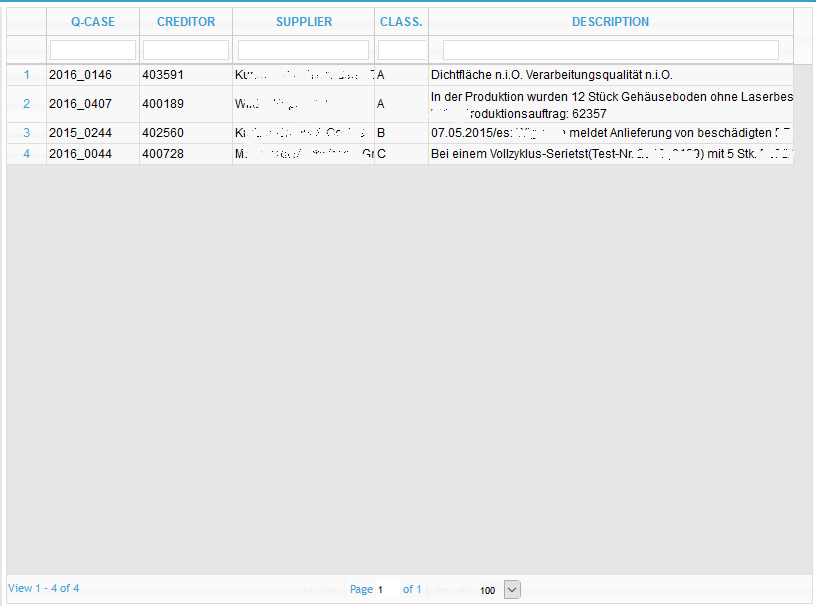
Additionally the failure categories can be analyzed further. If someone is interested in the Q-cases behind a specific category you can click on the respective bar to show a list of related q-cases.

As for all tables: right-clicking on a specific Q-case will open a new window with the detailed data of the case.